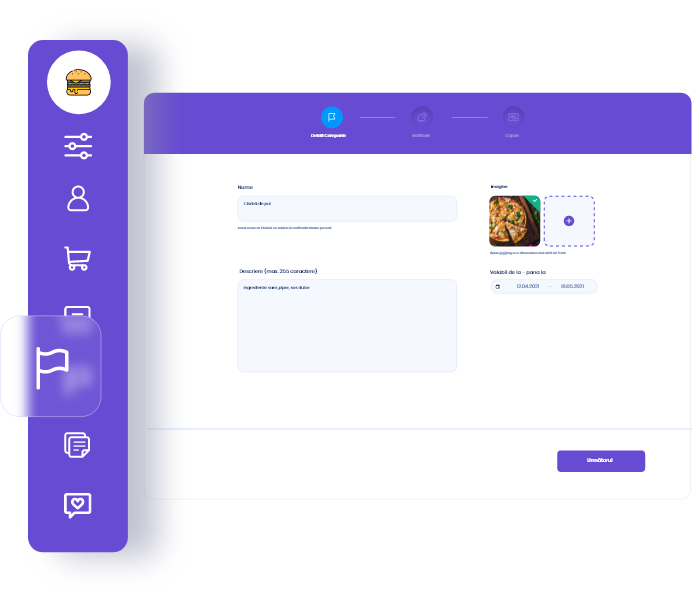
Rapoartele și statisticile din aplicație îți indică ce campanii funcționează, care sunt clienții fideli și produsele populare, precum și eventuale probleme de gestiune.
Panoul de comandă oferă o privire de ansamblu asupra zilei în curs, avand informații despre comenzile noi, încasări, clienți nou înregistrați și grafice defalcate pe ore.
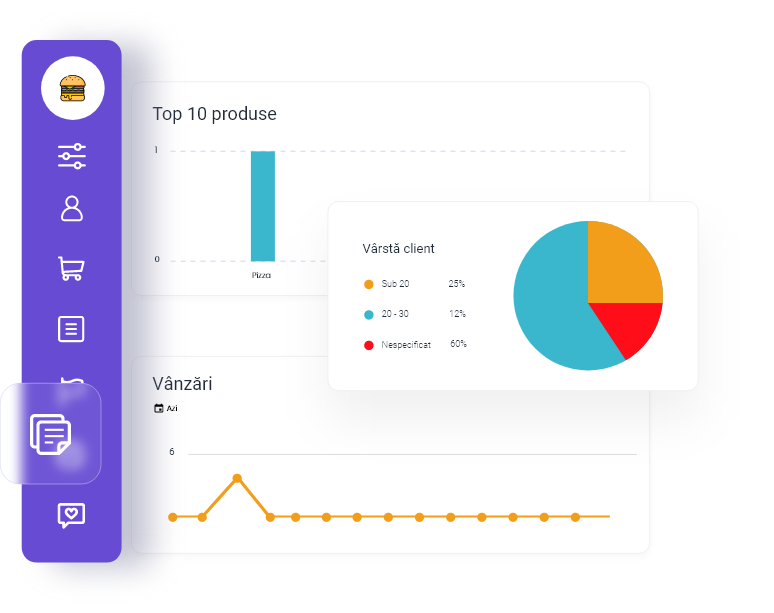
Rapoartele din această secțiune afișează o evoluție în timp a comenzilor, vânzărilor, clienților noi sau tipul celor mai populare produse.
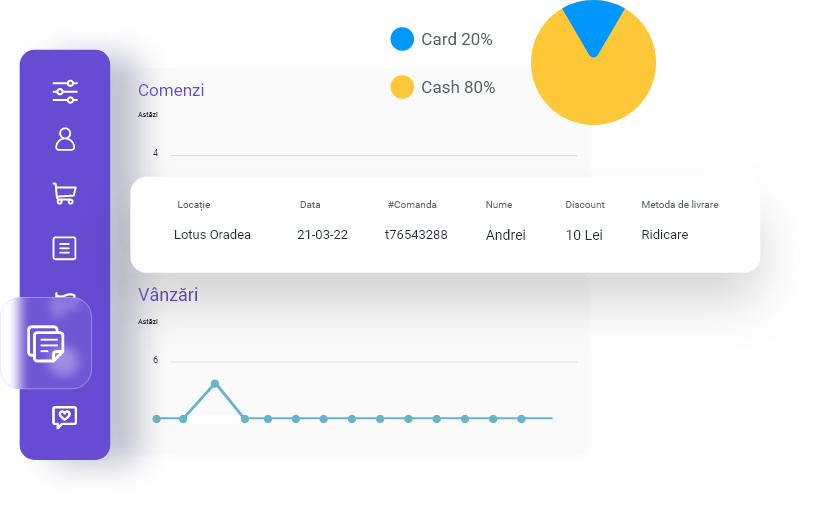
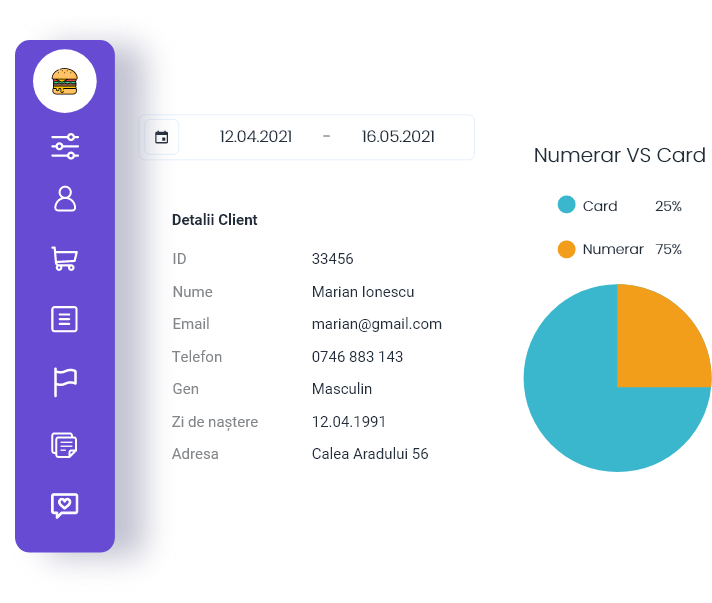
Te poți folosi de acest raport pentru a vedea ce sumă s-a încasat într-o anumită locație și perioadă, tipul plăților - card sau numerar - dar și o listă detaliată a comenzilor.
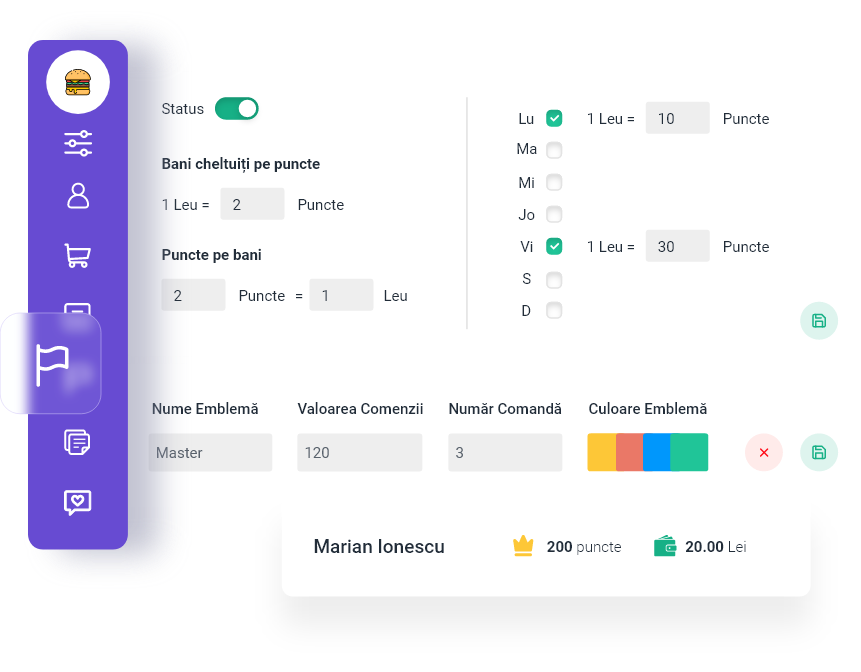
Acest tip de raport îți permite să filtrezi clienții în funcție de valoarea și numărul de comenzi plasate într-o anumită perioadă de timp.
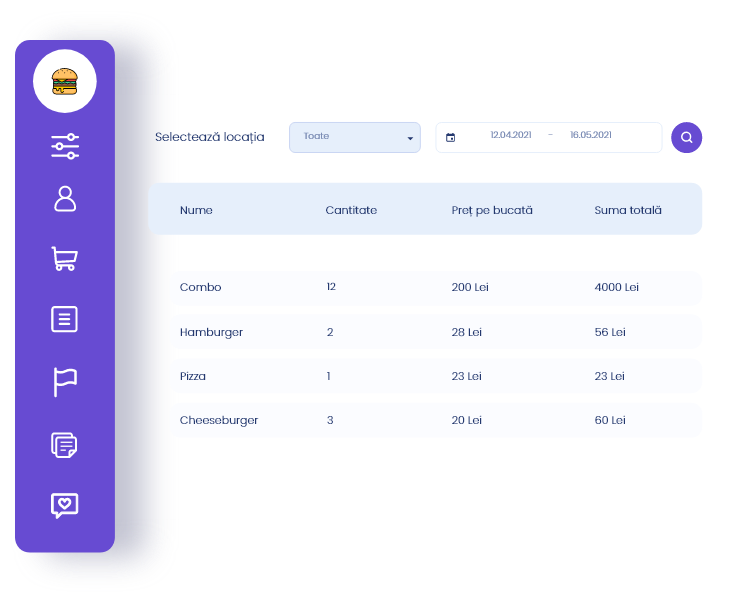
În cazul în care dorești să vezi situația produselor vândute, poți să generezi și să exporți un raport de vânzări dintr-o anumită perioadă.